
tracepath Command: Check Hops and Path MTU Instead of traceroute
On a Linux server, the tracepath command shows the path (hops) that packets take to a destination and the path MTU, without root privileges. On an AlmaLinux 9 server without traceroute installed, we limited the hop count to 10 and traced the path to example.com: response times and a path MTU of 1500 appeared up to the fourth hop, and the six hops after that did not respond.
The output below was run on an AlmaLinux 9.8 server (root account), and the traceroute version and package status were checked on a Debian 12 server (regular account). The IPv6 addresses of the first hop and the intermediate routers were replaced with documentation example addresses, while the response times and pmtu values were left as they were.
1️⃣ How to Use the tracepath Command
tracepath takes one destination name or IP address, sends UDP packets, and prints the hops that respond, one line each in TTL order. The default maximum hop count is 30, and you can change it with -m.
For example.com, we added -m 10 to check only up to the tenth hop.
tracepath -n -m 10 example.com 1?: [LOCALHOST] 0.006ms pmtu 9001
1: fe80::1%eth0 0.077ms pmtu 1500
1: 2001:db8:a::5b 2.627ms asymm 8
2: 2001:db8:a::52 1.473ms asymm 12
3: 2001:db8:b::1e 19.653ms asymm 9
4: 2001:db8:c:: 3.642ms asymm 11
5: no reply
6: no reply
7: no reply
8: no reply
9: no reply
10: no reply
Too many hops: pmtu 1500
Resume: pmtu 1500 This server sent packets to the IPv6 address of example.com, and response times appeared up to the fourth hop. From the fifth hop on, no reply continued, so the reached line showing that the destination was reached within ten hops never appeared, and the run took about 18 seconds to finish.
Running it against the same destination without -m did not finish within 30 seconds. For paths with many unresponsive hops, use -m to reduce the number of hops to check.
Check the installed tracepath version with -V; the tracepath on this server was iputils 20210202.
tracepath -Vtracepath from iputils 202102022️⃣ Reading tracepath Output
Each output line shows the hop number, the address that responded, and the round-trip time, in that order. pmtu is added where the path MTU changed, and asymm is added when the forward and return paths have different hop counts. Here is what to check on each line.
| Output | Meaning |
|---|---|
| 1?: | Hop number field — a ? is added when the number is guessed because no TTL was obtained from the reply |
| [LOCALHOST] | The line for the server itself, before the packet has left for the network |
| 0.077ms | Round-trip time to that hop |
| pmtu 1500 | Path MTU (bytes) changed at that point — added only when it changes |
| asymm 8 | Difference in hop count between the forward and return paths — the official manual says it is not a reliable value |
| no reply | A hop that did not respond to the packet sent with that TTL |
| reached | The line where the destination was reached |
| Too many hops | Stops after checking up to the hop count set with -m |
| Resume: pmtu … hops … back … | Path MTU for the whole route, hop count to the destination, and estimated return hop count |
In the example.com output, the pmtu on the first line [LOCALHOST] was 9001, and it changed to 1500 at the first hop. The TTL 1 line appearing twice with only the address changed is also the pattern shown in the official manual example. The manual explains that if the first packet is rejected at the first hop because of the path MTU, the same TTL line appears once more.
When the destination is reached, reached is added at the end of the line, and the final Resume line shows the hop count to the destination. Sending to 127.0.0.1 gave reached in a single hop, and the Resume line was [pmtu 65535 hops 1 back 1].
tracepath -n 127.0.0.1 1: 127.0.0.1 0.047ms reached
Resume: pmtu 65535 hops 1 back 1 A path that ends with Too many hops and no reached line did not get a response from the destination within the hops set with -m. The example.com path also had no reached line up to ten hops, so only pmtu remained on the Resume line, with no hop count.
3️⃣ tracepath Options
tracepath has only eight options: -4, -6, -n, -b, -l, -m, -p, and -V, and running it without a destination prints this list as the usage. Without options, it resolves the responding addresses to names, and sending to localhost showed localhost in the hop field.
tracepath localhost 1?: [LOCALHOST] 0.003ms pmtu 65536
1: localhost 0.048ms reached
1: localhost 0.030ms reached
Resume: pmtu 65536 hops 1 back 1 [tracepath -n] prints only IP addresses without resolving names. Adding -n for the same localhost changed the hop field to the IPv6 address ::1, and running the example.com path with -n also showed only addresses in the hop field.
tracepath -n localhost 1?: [LOCALHOST] 0.005ms pmtu 65536
1: ::1 0.039ms reached
1: ::1 0.010ms reached
Resume: pmtu 65536 hops 1 back 1 -b prints both names and addresses. Adding -b for 127.0.0.1 put the address in parentheses after the name, giving [localhost (127.0.0.1)].
tracepath -b 127.0.0.1 1: localhost (127.0.0.1) 0.050ms reached
Resume: pmtu 65535 hops 1 back 1 -m is the option that sets the maximum number of hops to check, and it accepted values from 0 to 255. Adding -m 0 printed only the Too many hops and Resume lines with no hop lines, and entering 256 was rejected with [out of range].
tracepath -m 0 127.0.0.1 Too many hops: pmtu 65535
Resume: pmtu 65535 -l is the length of the first packet sent, and the default is 65535 bytes for IPv4 and 128000 bytes for IPv6. Adding -l 1500 for 127.0.0.1 changed the pmtu on the Resume line from 65535 to 1500.
tracepath -l 1500 -n 127.0.0.1 1: 127.0.0.1 0.028ms reached
Resume: pmtu 1500 hops 1 back 1 -p is the option that sets the first destination UDP port to send to. The result of adding -p 33434 for 127.0.0.1 was the same as without it.
| Option | Copy | Description |
|---|---|---|
| -n | Print only IP addresses without resolving names | |
| -b | Print both names and addresses | |
| -mhops | Set the maximum number of hops to check, default 30 | |
| -llength | Set the length of the first packet, default IPv4 65535, IPv6 128000 | |
| -V | Print the version and exit |
| Option | Copy | Description |
|---|---|---|
| -4 | Sends to IPv4 addresses only | |
| -6 | Sends to IPv6 addresses only | |
| -pPort | Set the first destination UDP port to send to |
4️⃣ tracepath vs traceroute
On servers where traceroute cannot be installed, check the path with tracepath instead of traceroute. The AlmaLinux 9.8 server we checked had no traceroute package, while tracepath comes in the iputils package, so it ran without any separate installation.
rpm -q traceroutepackage traceroute is not installedThe Debian 12 server was the opposite. traceroute 2.1.2 was installed, and the iputils-tracepath package that contains tracepath was not installed.
traceroute --versionModern traceroute for Linux, version 2.1.2
Copyright (c) 2016 Dmitry Butskoy, License: GPL v2 or any laterapt-cache policy iputils-tracepathiputils-tracepath:
Installed: (none)
Candidate: 3:20221126-1+deb12u1As these two servers show, the commands available differ by distribution, so first check which one exists on the server you are connected to. tracepath does not need root privileges and can be run by any account that can send UDP packets. The tracepath executable on the AlmaLinux 9.8 server also had rwxr-xr-x permissions, with no extra capabilities attached.
| Item | tracepath | traceroute |
|---|---|---|
| AlmaLinux 9.8 server | Included in the iputils package, runs right away | Not installed |
| Debian 12 server | iputils-tracepath package not installed | traceroute 2.1.2 installed |
| Packets sent | UDP | UDP by default, -I for ICMP, -T for TCP |
| Output per hop | One line | Three probes by default, three times shown (change with -q) |
| Number of options | Eight: -4 -6 -n -b -l -m -p -V | More than 20 on the first --help screen alone |
If you need to trace the path with ICMP or TCP, or send several probes per hop to compare times, you will install and use the traceroute command. On servers where installing it is difficult, or where you also need to see the path MTU, tracepath is the right fit.
🔲 tracepath Command Simulator
In the simulator below, you can view the example.com path again with only the hop count changed, or enter -n, -b, -m, and -l yourself for localhost and 127.0.0.1 to see the differences.
🔢 FAQ & Recommended Content

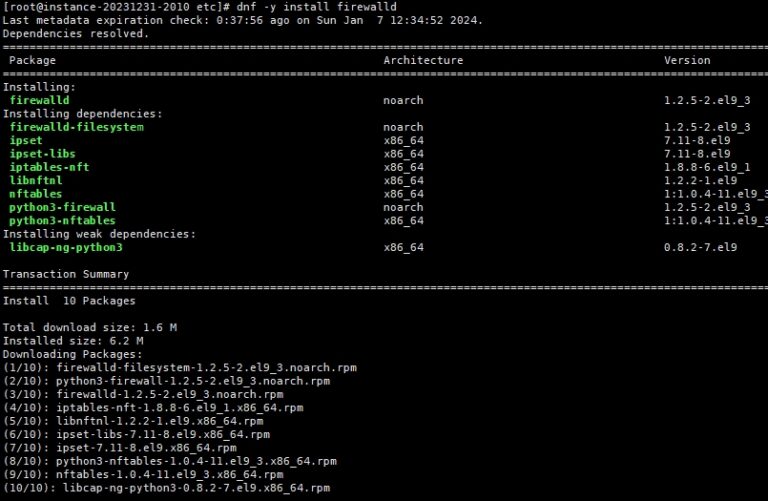 Firewall
Installing FirewallD on Linux and configuring the daemon
Installing FirewallD and configuring its daemon, which manages firewall rules with zones and services.
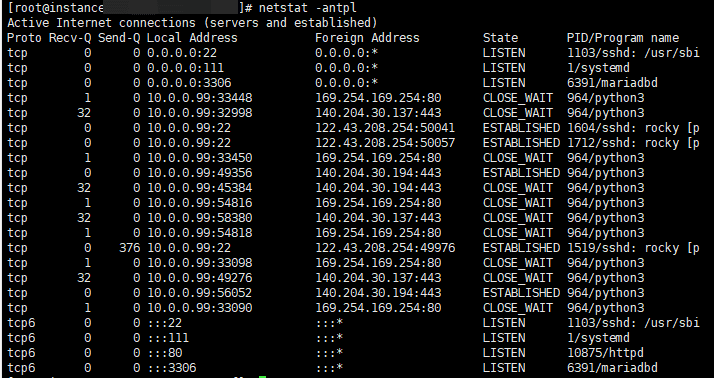 Network · Configuration
Linux netstat command, ifconfig command
The netstat and ifconfig commands, which show open ports, connection states, and network interface information.
 Network · DNS
nslookup command
The nslookup command, which asks a DNS server which IP address a domain name resolves to.
ℹ️ Affiliate Disclosure
This site's content contains affiliate links. When a visitor buys a product or service through one of them, the site receives a commission from the seller. The amount the buyer pays(it goes down during event discounts ↓)does not go up. Posted prices, discounts, and stock reflect the time of writing and may differ, so confirm with the seller before buying. Products are chosen and reviewed by our own standards, and commissions do not affect the order or content of reviews.